By Manisha Sahu, America News World
September 30, 2025
Who is Poor in Today’s India? An Updated Look at the Rangarajan Poverty Line
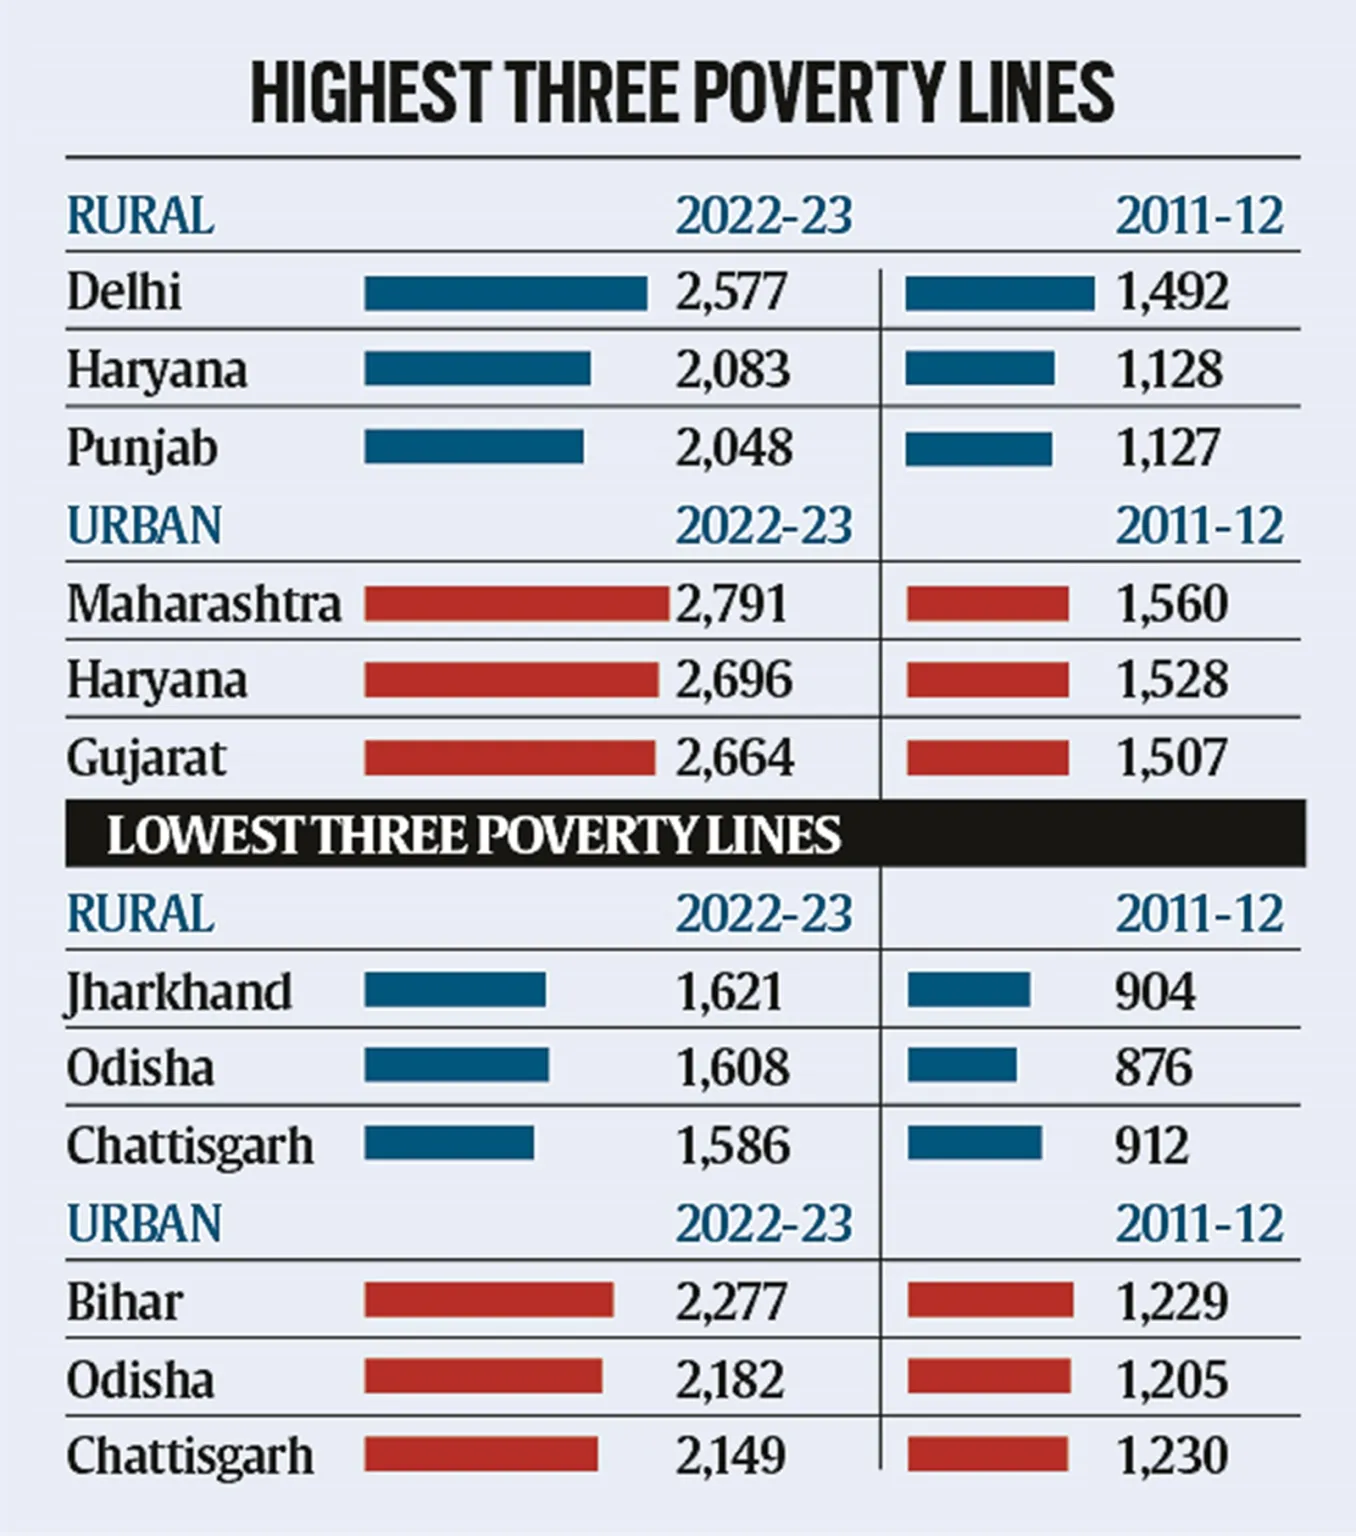
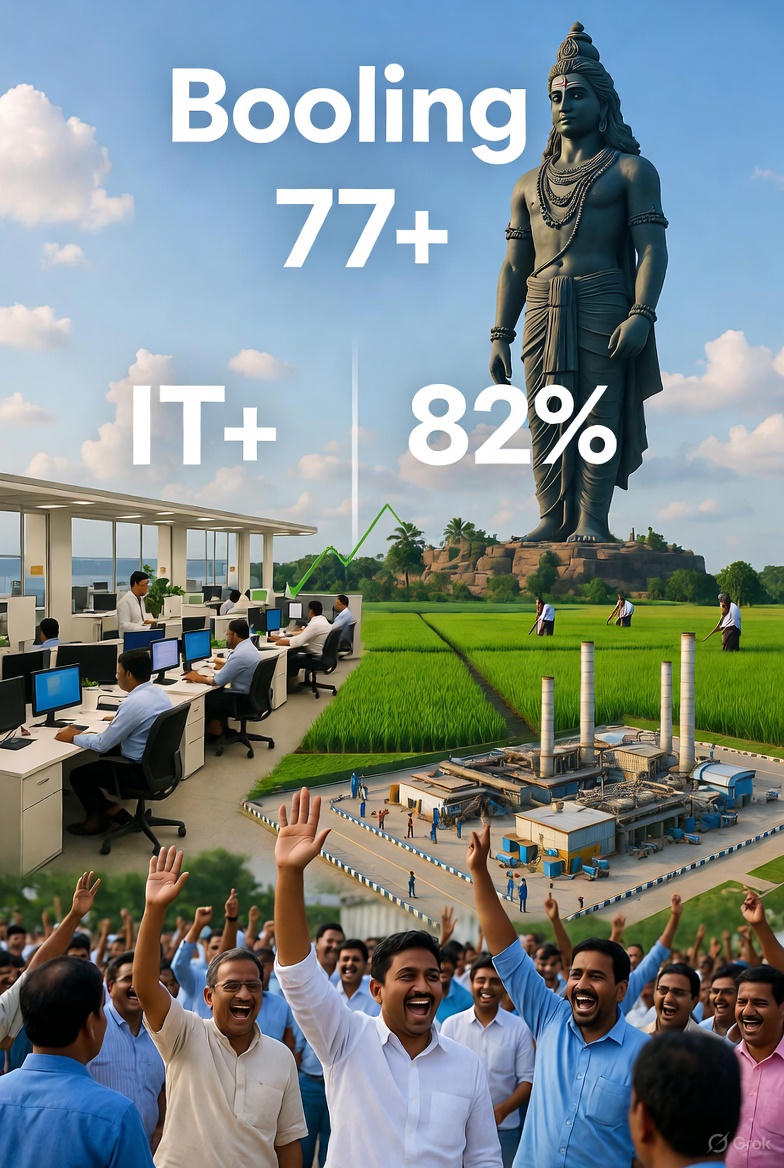
India’s poverty debates have resurfaced after economists from the Reserve Bank of India (RBI) updated the Rangarajan poverty line for 20 major states, using the government’s latest Household Consumption Expenditure Survey (HCES) for 2022-23. The findings reveal that states such as Odisha and Bihar, long associated with deep poverty, have shown the most striking improvements over the last decade, even though they started from a low base.
The Rangarajan Committee: A Quick Recap
Almost 15 years ago, in 2014, the erstwhile Planning Commission set up a committee under C. Rangarajan, a former RBI Governor, to review how India measured poverty. The committee estimated the national poverty line at ₹1,407 per month per person in urban areas and ₹972 in rural areas. This translated to ₹47 per day in urban India and ₹32 per day in rural India.
According to this threshold, anyone spending more than those amounts was considered above the poverty line. That assessment pegged India’s poor at 29.5% of the total population, sparking heated debates at the time. Since then, no official new poverty line has been created—until RBI economists revisited and updated it this year.
Big Movers: Odisha and Bihar
The RBI study shows remarkable progress in reducing poverty across several states, but Odisha and Bihar stand out.
Rural Odisha: Poverty fell from 47.8% in 2011-12 to 8.6% in 2022-23—the sharpest decline in the country.
Urban Bihar: Poverty declined from 50.8% in 2011-12 to 9.1% in 2022-23—again, the largest fall among states in urban India.
This translates into nearly a 40-percentage point reduction in poverty over a decade, a transformation few anticipated.
The Other Side of the Story
Not all states witnessed such dramatic changes. The decline was far more modest in Kerala and Himachal Pradesh. However, this is largely because both states already had relatively low poverty levels.
In Kerala, rural poverty dropped from 7.3% in 2011-12 to 1.4% in 2022-23.
In Himachal Pradesh, urban poverty fell from 8.8% to 2% over the same period.
In terms of absolute numbers, Himachal Pradesh now has the lowest rural poverty (0.4%), while Tamil Nadu records the lowest urban poverty (1.9%). At the other end, Chhattisgarh continues to struggle, with 25.1% rural poverty and 13.3% urban poverty, the highest in the country.
Why Not CPI?
One crucial aspect of the RBI economists’ approach is their rejection of simply inflating the old poverty line using the Consumer Price Index (CPI).
Here’s why: the CPI basket of goods and the Rangarajan Poverty Line Basket (PLB) differ significantly. For example:
In the rural PLB, food accounts for 57%, compared with 54% in rural CPI.
In the urban PLB, food accounts for 47%, compared with only 36% in urban CPI.
Given these differences, the RBI team created a new price index tailored to the Rangarajan basket, ensuring a more accurate inflation adjustment. They then applied this to the 2012 poverty lines to estimate current levels.
A Changing Consumption Landscape
The RBI study also acknowledges that India’s consumption patterns have changed since 2011-12. Just as the government periodically revises the CPI basket, the poverty line basket also needs updating. For instance, rising urbanization, digitization, and changes in dietary preferences mean that today’s poor spend differently than a decade ago.
Multiple Estimates, Multiple Stories
The debate over poverty in India has never been straightforward, and multiple institutions have arrived at very different conclusions.
SBI Research (2024) estimated poverty at 4.86% in rural areas and 4.09% in urban areas, using inflation-adjusted poverty lines.

World Bank (2019) concluded that India’s poverty rate was 10.2%.
IMF (2019), in contrast, estimated poverty at just 0.8%, citing government food transfers as a major factor.
This wide range highlights the challenges of defining and measuring poverty in a vast, diverse nation like India.
Multidimensional Poverty: The Government’s Focus
Interestingly, the Indian government has largely moved beyond income-based poverty lines and now emphasizes multidimensional poverty, which includes indicators of health, education, and living standards.
Based on the Global Multidimensional Poverty Index (MPI), India’s version considers 12 factors, ranging from nutrition and child mortality to access to electricity, sanitation, and bank accounts.
According to government data, between 2013-14 and 2022-23, about 248 million Indians escaped multidimensional poverty. The national multidimensional poverty rate dropped from 29.17% to 11.28% in less than a decade.
So, who is poor in today’s India?
If one uses the updated Rangarajan poverty line, states like Odisha and Bihar show remarkable progress, while Chhattisgarh lags behind.
If one uses SBI’s inflation-adjusted lines, poverty is in single digits nationwide.
If one takes the government’s multidimensional view, nearly one in nine Indians still live in poverty.
At the World Bank’s $4.2/day line, India’s poverty rate stood at 23.9% in 2022—much higher than domestic estimates.
The answer, then, depends on which yardstick is chosen. But what is clear is that poverty in India—whether measured by income or broader living standards—has declined sharply over the past decade, even as debates over methodology remain unresolved.
share your views on comment box or write us – americanewsworld@gmail.com
Discover more from AMERICA NEWS WORLD
Subscribe to get the latest posts sent to your email.


















Leave a Reply